THE CHALLENGE:
Satellites have been orbiting the earth for decades, all the while taking pictures of the ground below. The pictures they take get processed and stored, and after a while, archived. With some clever thinking, we can make sure to use the full value of those image archives. The challenge for researchers is using historical archives of satellite data for producing useful science today. Statistician Dr Dale Roberts and geologist Dr John Wilford from The Australian National University and Geoscience Australia respectively have teamed up to reanalyse the entire 30-year archive of Landsat satellite images of Australia and produce an entirely new research data product.
THE SOLUTION:
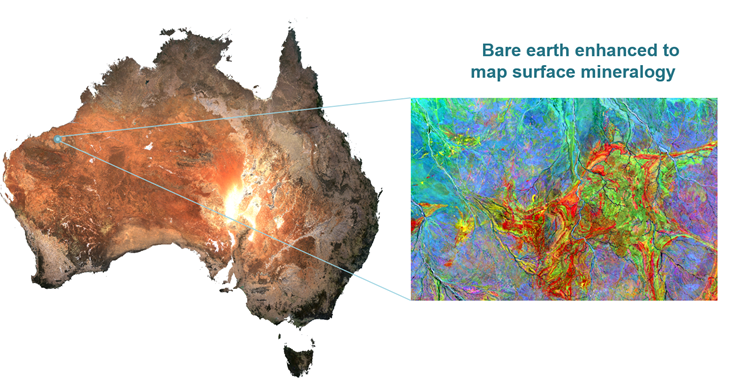
Drs Roberts and Wilford, looking to make new use of existing satellite datasets, have used NCI’s supercomputer and data collection management tools to produce a new map of Australia. This map shows the earth in a state with the lowest possible level of vegetation to occur at that location. Built of a systematic analysis of the entire Petabyte-scale Landsat archive – itself stored at NCI – the map provides a composite image of the entire country with every single pixel calculated to show the barest possible soil. The map, called the Barest Earth map of Australia, is a stunning view of our country’s surface when all vegetation, urbanisation and bushfire scars are removed. The researchers here were motivated to make a new scientific data product that can be used as a foundational data input for other researchers’ work.
THE FUTURE:
NCI’s unique integration of massive data collections alongside a world-class supercomputer enables data-intensive work that would otherwise be impossible to undertake. The researchers are now remaking the map with newer, higher resolution satellite images that will give even more clarity to the national map. By building even more efficient statistical processing algorithms and leveraging the ever increasing incoming satellite datasets, national maps revealing the structure and formation of our continent are on their way. Environment management, mineral exploration and land monitoring all stand to benefit from access to these kinds of computer-driven data products.
Read the full paper here: Exposed soil and mineral map of the Australian continent revealing the land at its barest